TALENT ENGINEERING TECHNOLOGY®
Standards, Measures, Solutions to Work-People-Environment Compatibility
We seeking a commercial buyer to acquire Talent Engineering Technology® intellectual property and associated business assets

We seeking a commercial buyer to acquire Talent Engineering Technology® intellectual property and associated business assets

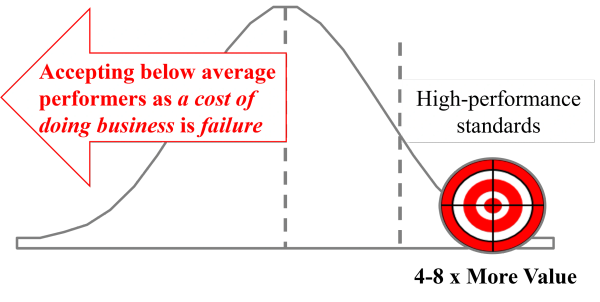
Top performers add 4-8 times more value than average but managers have grown so complacent they perpetuate the false belief that "Average" is good.
This is wrong because Industry-leading competitors are setting higher standards for the organization


This value gap is largest exactly where it costs the most. Here is what the talent gap means in dollars:

We collected and analyzed millions of data points on what distinguished thousands of top performers in diverse jobs in global, industry- leaders like Alcatel, Hitachi, J&J, Nokia and Texas Instruments.
Our tech worked so seamlessly with existing HR tools they issued us contractor badges to deploy it worldwide.
We earned long-term contracts because we delivered results and enabled them to self-reliantly use the technology to gain control of performance variance.
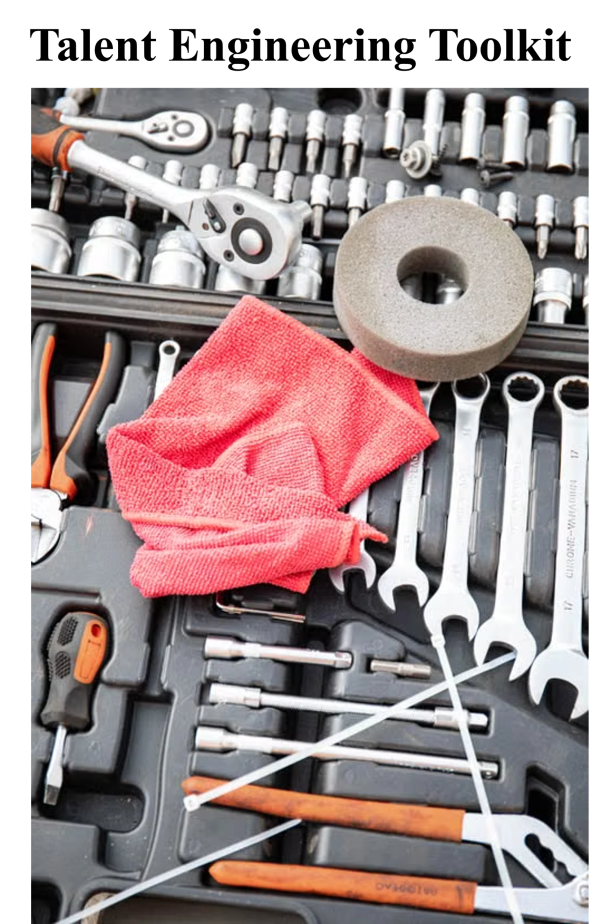
Users' License includes 6 Application tools to help you Hire-Develop-Engage-Retain Top Performers

A client CFO reported that our Success Profile added $14M in annual sales revenue to their business. After using it to improve hiring quality it was applied to existing sales pros and improved their performance
Hires matching a Profile of job-related top performers are more productive
Money and time saved by reducing turnover can be put to productive use
Everyone in a Profiled job gets a 'working model' of how to succeed in that job
Employees with Profiles share success advice and methods with peers
Managers in Profiled jobs spend less time supervising and more time coaching
Productive people don't quit, are absent less, and better serve customers

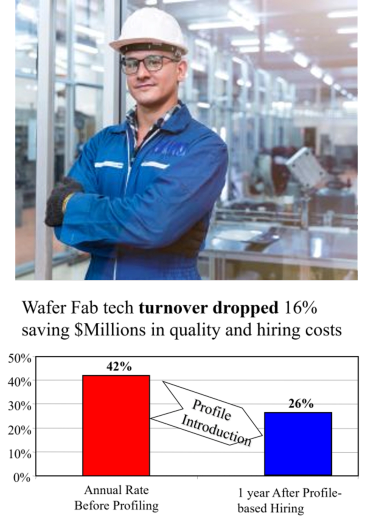
In a wafer fab operation, technician turnover cost $millions in production errors-delays, and poor quality , so we analyzed what distinguished techs with high work quality, low turnover, and conscientious work habits and then provided standards, and measures to apply in hiring
RESULT: turnover dropped 16%, Quality and productivity increa
In a wafer fab operation, technician turnover cost $millions in production errors-delays, and poor quality , so we analyzed what distinguished techs with high work quality, low turnover, and conscientious work habits and then provided standards, and measures to apply in hiring
RESULT: turnover dropped 16%, Quality and productivity increased
All sourcing agencies were required to apply these standards-measures

We led an international team of psychologists and talent consultants in the development of a leadership assessment, development and coaching process that defined and measured leaders on 21 criteria
510 middle managers and top executives were assessed, given feedback and coached on the 21 leadership standards.
One year later, leaders coached
We led an international team of psychologists and talent consultants in the development of a leadership assessment, development and coaching process that defined and measured leaders on 21 criteria
510 middle managers and top executives were assessed, given feedback and coached on the 21 leadership standards.
One year later, leaders coached on 21 standards received significantly higher feedback ratings from their managers, peers, and subordinates
360 feedback ratings of managers who were not assessed or coached on the 21 standards did not improve.
Most of them voluntarily adopted the standards the following year

A 90-item Work-People-Environment survey was conducted on over 600 production plant employees and their managers. Analysis of organization culture-climate issues causing dissatisfaction were reported to site-wide teams of employees who solved most issues by themselves.
Leadership team meetings were also held to report survey results and p
A 90-item Work-People-Environment survey was conducted on over 600 production plant employees and their managers. Analysis of organization culture-climate issues causing dissatisfaction were reported to site-wide teams of employees who solved most issues by themselves.
Leadership team meetings were also held to report survey results and plan interventions. The need for the Climate Survey was apparent when we found only a few leaders were aware of employee dissatisfaction
This one MEASUREMENT proved more powerful, useful and reliable than a thousand opinions
Talent assessment and development tools/methods proved so effective and valuable to one client they offered us $1 Million to buy it.
However, that component of Talent Engineering Technology catalog was central to our ongoing research and client support so we declined.
It did however, clearly show us how much clients valued our work.
Talent Engineering analytics was used to accurately predict job performance ratings for 42 HR professionals with 87% accuracy.
The analysis was used to reassign 14 people to roles fitting their talents
73% of scheduled layoffs avoided.
A workforce alignment analysis uncovered hidden, transferable talent and reassigned 41 of 56 mechanical engineers scheduled for layoff - saving jobs, employee morale and termination costs
Talent Engineering Technology® is a proprietary, science-based system for identifying what distinguishes high performers, measuring job-specific talent, predicting performance, and translating insights into targeted development.
Developed over decades of applied research and enterprise use, the TET combines proprietary analytical methods, assessment tools, Success Profiles, learning solutions, and implementation resources.
We are seeking a strategic buyer to acquire the entire Talent Engineering Technology business and its associated intellectual property and assets. The opportunity is to integrate and commercialize this established technology through an organization with the reach, infrastructure, and customer base to scale it.
Schedule a confidential introductory discussion with the owner by contacting me
Differentiated by high achievable standards, objective measures and precise Solutions
5 top corporations relied on our technology for so long they issued us contractor badges